
One Prometheus to Rule Them All: Multi-Tenancy Kubernetes with Centralized Monitoring and vCluster Private Nodes
veröffentlicht am 10.02.2026 von Dominik Heilbock
Discover how platform teams can implement centralized metrics for multi-tenant Kubernetes using vCluster. This article walks through observability patterns for both regular vClusters and private-node vClusters, showing how a centralized Prometheus and Grafana stack can serve many isolated tenant clusters, laying the foundation for scalable, production-ready multi-tenant observability.
The Need for Multi-Tenancy
As platform engineers, we build shared platforms that serve multiple teams. A core decision is tenant separation, which often comes down to separating teams by namespaces with scoped RBAC. This pattern is easy to implement and has little administrative and infrastructure overhead. However this comes at the cost of weak isolation and a shared blast radius, as all tenants share the same API-server. Drawbacks of a shared API-server become especially visible when teams rely on Kubernetes operators such as the Prometheus Operator or logging operators. In a shared API server model, operators are difficult to isolate because they typically install cluster-scoped resources like CRDs and assume ownership of certain APIs. As a result, different teams cannot independently choose operator versions. For example, if Team A needs Prometheus Operator v4 while Team B wants to adopt v5, the shared API server forces a single version for all tenants. This tight coupling reduces team autonomy and complicates independent upgrade cycles, further exposing the limits of namespace-based multi-tenancy. These drawbacks can be addressed by offering each tenant their own cluster, leading to significant administrational overhead and often idle resources. Platform Teams want little administrational overhead and complexity and users strong seperation with isolated quotas and policies. This usually leads to the conflict that we want a model that feels like a cluster to the tenant, but remains manageable like namespaces for the platform team.
Bridging the gap with vCluster
vCluster provides virtual Kubernetes clusters deployed within a host cluster, each with its own virtual control plane. This offers stronger autonomy and isolation than namespace-based separation, while requiring less overhead than dedicating a full cluster per tenant. In this article, we will focus on two different vCluster models: A regular vCluster that shares worker nodes with other tenants and the host cluster and vCluster private nodes, that use their dedicated worker nodes to also isolate tenants on the infrastructure level.
The Need for centralized metrics
In a multi-tenant environment, metrics collection becomes a platform responsibility. Deploying separate stacks for each tenant quickly adds complexity with little benefit, and running the same metrics stack per tenant is resource-intensive. Centralizing this stack in the host cluster ensures simplicity, less resource usage and that metrics dont scale with tenants. Also, debugging and upgrading are simplified since there is a single, centralized control point. This is why this pattern is often the go-to for platform teams. vCluster fits naturally in this pattern. While tenants operate their own virtual clusters, the workloads ultimately run on a shared set of nodes in the host cluster.
The goal of this article is to highlight possible implementations for centralized metrics gathering with vCluster.
Regular vCluster
As explained earlier, we will create the setup for regular vClusters and private nodes. This article will start with regular ones. The code to follow along can be found in this GitHub repository under vcluster_commands.md. With regular vClusters, the cluster admin can see all pods of the vCluster in the host cluster with -<vcluster_name> added to them. Meaning if for example Falco is deployed in the vcluster with the name tenant-x, the pod is exposed to the host cluster as falco-tenant-x in the namespace in which the vCluster is deployed. A vCluster is always linked to a namespace in the host cluster. Users that use the vCluster can however access it and interact with it through its own control plane, thus never see the host cluster or other vClusters.
For our metrics setup in the host cluster, this means that we can deploy the kube-prometheus-stack in the host cluster. Automatic scraping works for node, pod, and container metrics via kubelet/cAdvisor. Application-level /metrics endpoints still require explicit configuration via e.g a ServiceMonitor, PodMonitor, or annotations.
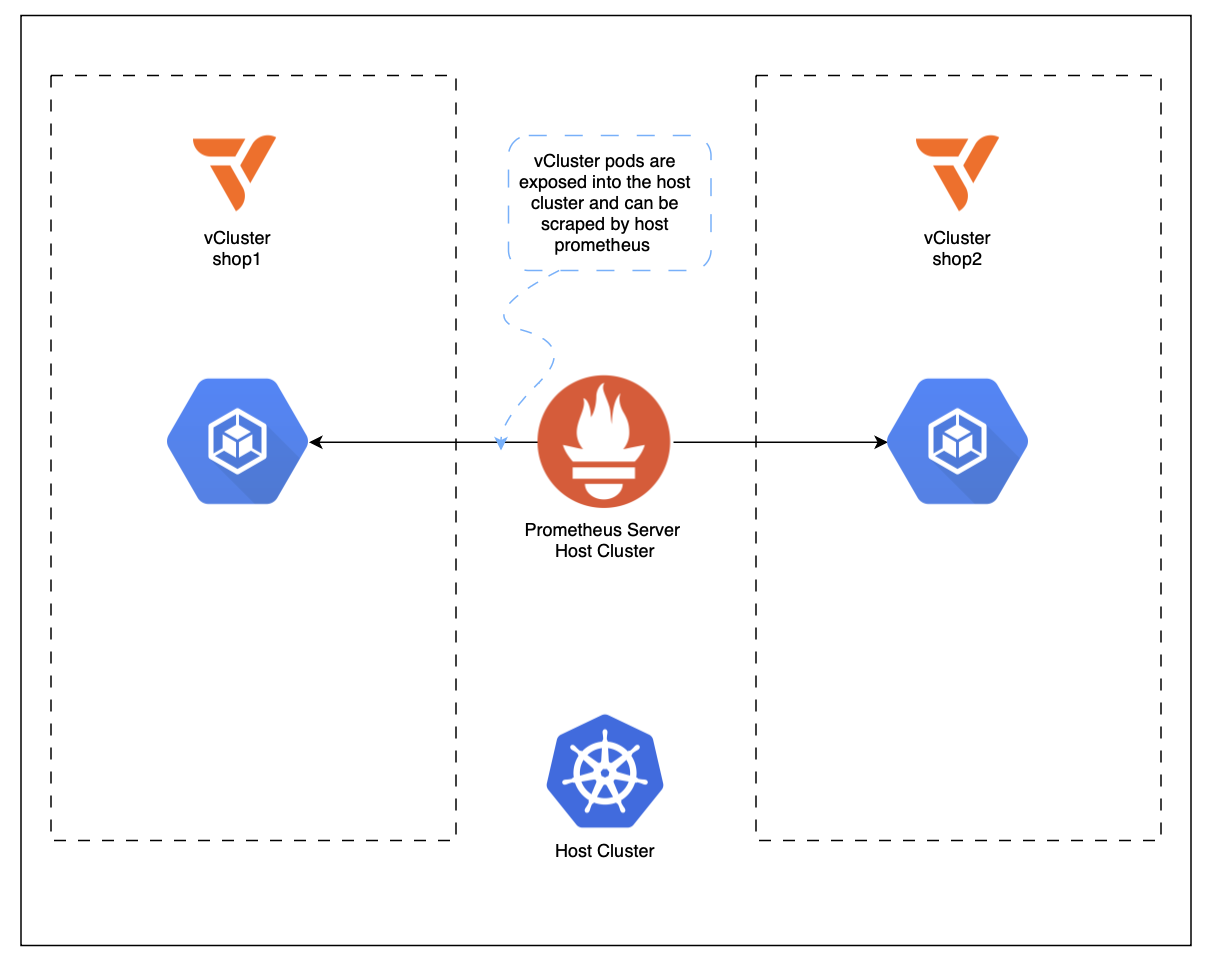
For this demo setup, two vCluster will be created in a central minikube host cluster and the google onlineboutique application is deployed in them to generate some metrics. The first vCluster is called shop1 and the second one shop2. Grafana in the host cluster will expose dashboards for both clusters, however users can just view one of them depending on their belonging. In an enterprise setup one would map ldap users to these permissions, in this demo two Grafana users are created, one for each vCluster, who can only view their respective dashboards.
We start by bringing up the host cluster and preparing three namespaces: one for monitoring, and one per tenant. With the base in place, we install the monitoring stack once into the host cluster (Prometheus, Grafana, Alertmanager via kube-prometheus-stack). Prometheus is now watching the host cluster and will use standard Kubernetes service discovery to find scrape targets. In a regular vCluster model, that is sufficient because the tenants’ workloads will ultimately surface in the host cluster as normal Kubernetes objects.
Next, the two tenant vClusters (shop1 and shop2) are created, each inside its respective host namespace. Each vCluster comes with its own API endpoint and authentication material (kubeconfig). From a tenant’s point of view this is the moment where the experience switches from “shared platform namespace” to “my own cluster”. They can now create namespaces, deploy Helm charts, apply RBAC, and operate workloads against a control plane that is isolated from other tenants.
After that, the demo application is deployed into each vCluster. Even though the tenants submit manifests to their virtual API servers, the pods that actually run are scheduled onto the shared worker nodes of the host cluster and appear in the corresponding host namespace for the cluster admin. This is the critical behavior that makes centralized monitoring so elegant here: Prometheus does not need to connect to each tenant control plane; it simply observes the workloads where they physically execute. In other words, tenant separation happens at the control plane boundary, while observability happens at the shared data plane.
Once both tenants run the same workload, Grafana in the host cluster can immediately show metrics for both. The remaining step is to turn “central visibility” into “tenant-safe visibility”. In the demo, this is achieved by organizing dashboards per tenant via a folder per vCluster and restricting access so each tenant user can only view their own dashboards.
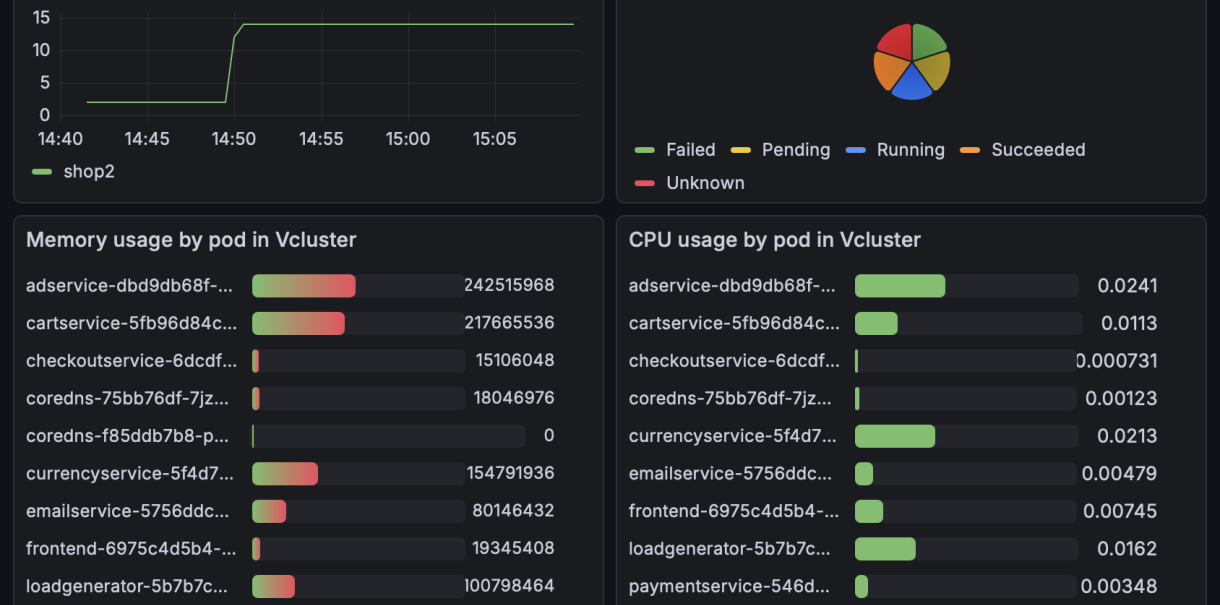
Above is the sample dashboard for vCluster shop2 that is exposed in the host cluster.
The result is one monitoring stack to operate, many tenant clusters to serve, and a clear separation of responsibilities. Platform engineers manage the host cluster and observability, while tenants manage their workloads against their vCluster API. The trade-off is also explicit: because worker nodes are shared in the regular model, isolation is not at the infrastructure level, setting up the motivation for the next section on vCluster private nodes.
Private Nodes
private_node_commands.md in the Github repository.enableRemoteWriteReceiver: true.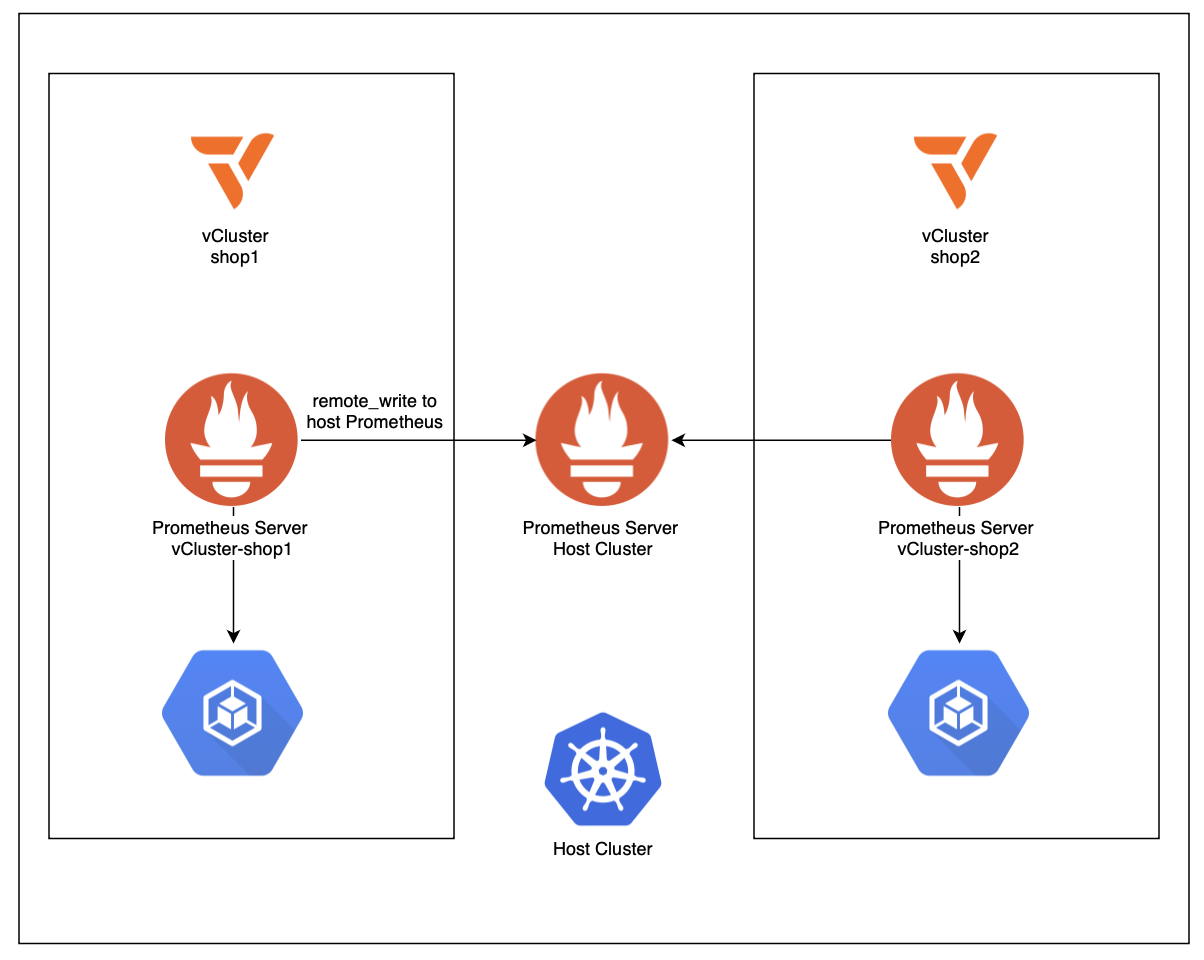
-shop1 / -shop2) and then scoping Grafana dashboards to those namespaces. It’s an easy pattern to understand and works well for a demo. For a more production-oriented approach, you can enforce a consistent tenant label on all workloads/metrics, e.g. vcluster=<name>. The end result mirrors the promise of the setup: centralized Prometheus, Alerting and Grafana with tenant-separated views, but it acknowledges the reality of private nodes: collection must happen inside each tenant boundary first, and only then can metrics be aggregated centrally in a controlled way.One limitation remains: In private-node vClusters, live kubelet metrics for vCluster pods will not be scraped by prometheus by default. This can be circumvented by installing this custom otel-collector.
Key Takeaways