Multi-Tenant Observability with vCluster: Centralized Metrics and Logs Using Prometheus, Loki, and Grafana
published at 04-22-2026 by Dominik Heilbock
Discover how platform teams can implement centralized metrics and logging for multi-tenant Kubernetes using vCluster. This article walks through such an architecture for private-node vClusters, showing how a centralized observability stack can serve many isolated tenant clusters, laying the foundation for scalable, production-ready multi-tenant observability.
This article builds upon our previous exploration of centralized metrics collection with vCluster and extends the observability stack by introducing centralized logging using Promtail and Loki.
The Need for Multi-Tenancy
As platform engineers, we build shared platforms that serve multiple teams. A core decision is tenant separation, which often comes down to separating teams by namespaces with scoped RBAC. This pattern is easy to implement and has little administrative and infrastructure overhead. However, this comes at the cost of weak isolation and a shared blast radius, as all tenants share the same API server. Drawbacks of a shared API server become especially visible when teams rely on Kubernetes operators such as the Prometheus Operator or logging operators. In a shared API server model, operators are difficult to isolate because they typically install cluster-scoped resources like CRDs and assume ownership of certain APIs. As a result, different teams cannot independently choose operator versions. For example, if Team A needs Prometheus Operator v4 while Team B wants to adopt v5, the shared API server forces a single version for all tenants. This tight coupling reduces team autonomy and complicates independent upgrade cycles, further exposing the limits of namespace-based multi-tenancy. These drawbacks can be addressed by offering each tenant their own cluster, but this leads to significant administrative overhead and often idle resources. Platform teams want little administrative overhead and complexity, while users want strong separation with isolated quotas and policies. This usually leads to a conflict: we want a model that feels like a cluster to the tenant, but remains as manageable as namespaces for the platform team.
Bridging the Gap with vClusters
vCluster provides virtual Kubernetes clusters deployed within a host cluster, each with its own virtual control plane. This offers stronger autonomy and isolation than namespace-based separation, while requiring less overhead than dedicating a full cluster per tenant. In this article, we focus on vCluster private nodes, which use dedicated worker nodes to also isolate tenants at the infrastructure level.
The Need for Centralized Observability
In a multi-tenant environment, metric and log collection becomes a platform responsibility. Deploying separate stacks for each tenant quickly adds complexity with little benefit, and running the same metrics and logging stack per tenant is resource-intensive. Centralizing this stack in the host cluster ensures simplicity, lower resource usage, and that the observability footprint does not scale with the number of tenants. Debugging and upgrading are also simplified since there is a single, centralized control point. This is why this pattern is often the go-to for platform teams. vCluster fits naturally into this pattern. While tenants operate their own virtual clusters, the workloads ultimately run on a shared set of nodes in the host cluster.
The goal of this article is to highlight possible implementations for centralized metrics and log gathering with vCluster private nodes.
Setup
For this setup, AWS EKS is used and a vCluster free or enterprise license is needed. The commands to follow along, plus the Terraform code to create the cluster, are available under commands.md in the GitHub repository.
Once the EKS foundation is up, the platform provisions two tenant vClusters (shop1 and shop2). The defining step here is that specific EC2-backed worker nodes are assigned to each vCluster as private nodes, so the tenants no longer share compute with each other or with the host cluster. This tightens isolation at the infrastructure layer and avoids many noisy-neighbor and co-scheduling concerns, but it also means the host cluster no longer has direct access to the tenant workload objects for scraping.
Metric Setup
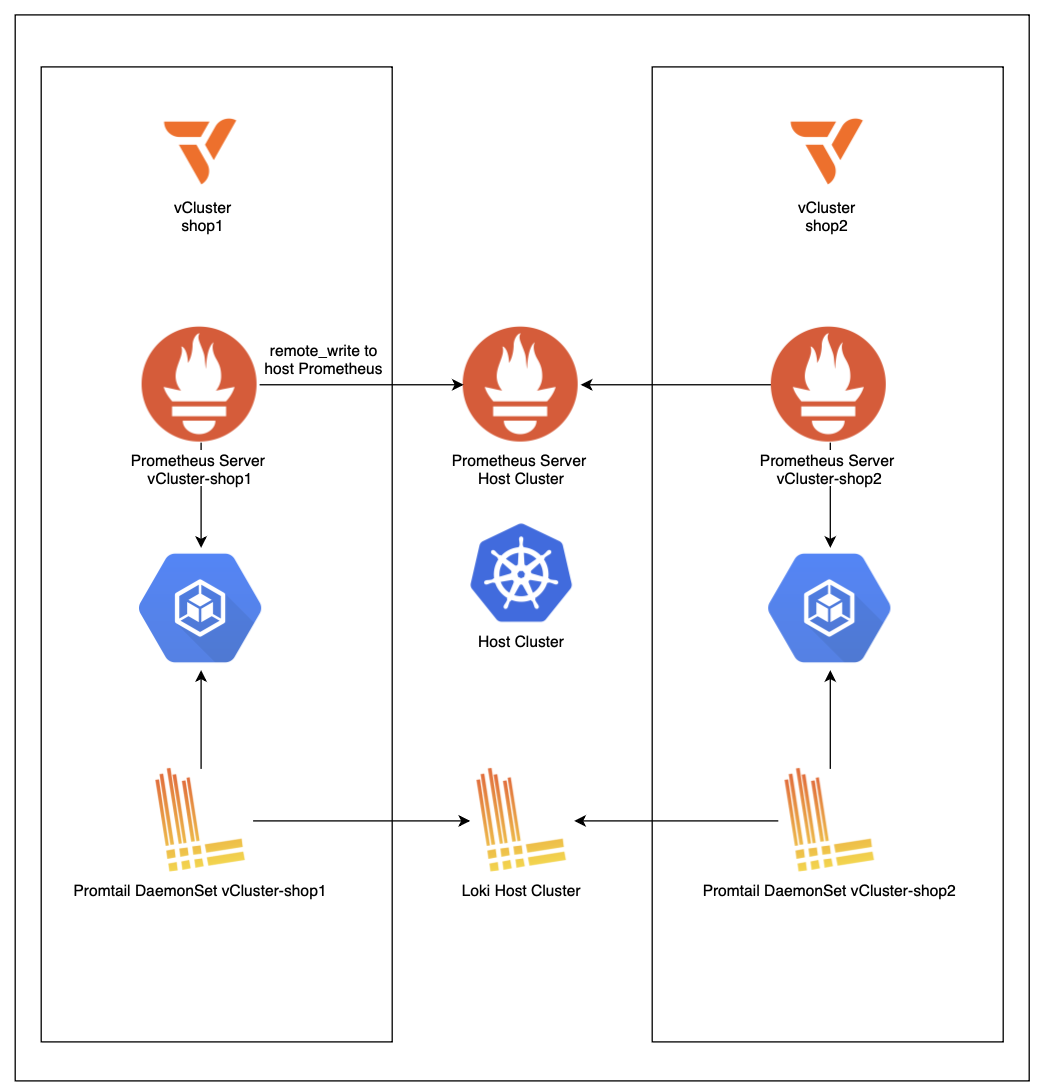
That brings us to centralized monitoring: we still want one kube-prometheus-stack from an operational perspective, but we can no longer rely on the host Prometheus discovering tenant pods directly. The solution introduced in this article is a Prometheus server per tenant.
Each vCluster runs a minimal Prometheus whose job is to scrape inside the private-node environment where the pods are actually visible. That per-tenant Prometheus is configured to remote write into the central Prometheus running in the host cluster. The host Prometheus needs to be enabled as a remote write receiver via
enableRemoteWriteReceiver: true.To make that forwarding possible without exposing the monitoring stack publicly, the host Prometheus endpoint is published as an internal load balancer. Because the host cluster and the vClusters live within the same VPC, the tenant-side Prometheus instances can securely reach the host Prometheus over private network paths. This preserves the key platform benefits: a single place for alerting, retention, and Grafana, while adapting to the reduced visibility that private nodes introduce.
Logging Setup
The logging setup follows a similar pattern to metrics, though it is somewhat simpler to implement. Loki is deployed as a SingleBinary in the host cluster and exposed as an internal NLB, reachable by all vClusters within the same VPC. Since this is a centralized single-instance setup,
auth_enabled is set to false, removing the need for per-tenant authentication headers.Each vCluster runs a Promtail DaemonSet that scrapes logs from the node's
/var/log/containers directory and ships them directly to the central Loki instance. During collection, Promtail adds a cluster=vcluster-<name> label to every log stream, which enables clean tenant separation when querying in Grafana. For example, logs from shop1 can be filtered with {cluster="vcluster-shop1"} and further scoped by namespace, application, or log level.One important consideration for production: Loki in this setup uses an
emptyDir volume, meaning logs are not persisted across pod restarts. For a production deployment, this should be replaced with a persistent volume or object storage backend such as S3.Tenant-Scoped Dashboards
Dashboards must remain tenant-scoped to preserve the isolation experience. In this demo, this is handled in a deliberately simple way by naming namespaces with a tenant suffix (e.g., appending
-shop1 or -shop2) and scoping Grafana dashboards to those namespaces. Logs follow the same pattern, separated between vClusters using the cluster label added by Promtail. It is an easy pattern to understand and works well in practice. The result mirrors the promise of the setup: centralized Prometheus, Loki, and Grafana with tenant-separated views, while acknowledging the reality of private nodes — collection must happen inside each tenant boundary first, and only then can metrics and logs be aggregated centrally in a controlled way.Key Takeaways
We have explored how centralized metrics and log collection can be implemented in multi-tenant Kubernetes platforms using vClusters. While Kubernetes provides basic observability tools per cluster, scaling these stacks independently for each tenant quickly becomes complex, resource-intensive, and difficult to manage. Centralizing metrics and logs in the host cluster addresses this by providing a single operational point for Prometheus, Loki, Grafana, and alerting, while tenants continue to interact with their isolated virtual clusters.
In this article, we demonstrated how tenant workloads running in regular vClusters are automatically visible to the host cluster Prometheus, and how in private node setups, metrics can be safely collected per tenant using lightweight Prometheus instances with remote write to a central Prometheus. We also showed how logs can be centralized using Promtail and Loki, following the same pattern: Collection inside each tenant boundary first, then aggregation centrally, with tenant separation maintained via the
cluster label in Grafana.These patterns ensure that platform engineers can operate a single observability stack efficiently, while tenants retain an isolated, cluster-like experience.