
FinOps Meets AI: Leveraging Amazon Forecast for Informed AWS RDS Reservations
veröffentlicht am 15.01.2024 von Vanessa Kantner
Discover how AI can enhance FinOps capabilities like rate optimization and AWS Reserved Instances purchases. Our blogpost details the implementation of Amazon Forecast to predict usage patterns, providing strategic insights for cost-effective decision-making and reservation purchases. Learn how to transform billing level data into actionable forecasts for intelligent cloud cost management.
Authors: Vanessa Kantner, Kim Lindner, Paul Rooch
When it comes to the Public Cloud Providers purchasing model, the traditional on-demand or pay-as-you-go is the most expensive option. To increase cost efficiency in the pricing dimension, providers have been offering the option of purchasing so-called Committed Use Discounts as an alternative. This implies the customer committing to their cloud resources (usage or spend) over a period, resulting in substantial pricing discounts in return.
________________________________
HINT
Improving cost efficiency in the public cloud is bound to two levers: Usage and Rate. Both dimensions can be optimized by using FinOps – a framework for getting the most business value out of your cloud usage. To learn more, check out the FinOps Foundation.
________________________________
This commitment purchase is supported by recommendations of the cloud providers, as well as by third-party cloud cost management tools. In addition to parameters, such as duration and payment options, these recommendations also require information on the length of the historical data on which the analyses are based. For the latter, typically three options are provided: to analyze the last 7, 30 or 60 days of usage to base the recommendation on. We usually recommend not buying the resulting reservation recommendations without careful consideration. Especially, the duration of the historical dataset involves several risks of not capturing the full range of usage due to:
- Unexpected usage spikes or dips
- Seasonal or cyclical patterns
- Recent changes in application architecture
- Future Workload Growth
To address these challenges, it's essential to supplement the automated recommendations with a thorough understanding of your specific business requirements and regular review. However, this can prove to be very time-consuming, especially in large organizations that entail a lot of complexity, as it was also the case with our customer’s use case. We had the task of setting up an optimal purchasing strategy for AWS Relational Database Service (RDS) Reserved Instances (RI) for an enterprise customer. Reserved Instances are commitments that cover cloud resource usage.
AWS RDS Reservations are bound to three parameters: they apply to a specific region, database engine (MySQL, MariaDB, PostgreSQL, Amazon Aurora or BYOL) and to an instance family. Instance size within an instance family can be ignored by normalizing the usage with the corresponding factors given by AWS.
Due to the limitations of cloud-native tools on the one hand, and the availability of almost 3 years of historical cloud and usage data on the other, we decided to use the power of AI to provide more reliable recommendations.
Our Solution
To achieve this, we deployed a machine learning model using Amazon Forecast. Amazon Forecast is a fully managed service that utilizes artificial intelligence with advanced statistical and machine learning algorithms. It is designed for users who may not have prior knowledge of machine learning. Forecasts can predict future time-series data by analyzing historical information. It is versatile and can be applied across various sectors, enabling users to predict metrics specific to their individual domains.
When working with Amazon Forecast, users upload historical data with timestamps and create a predictor—a model that autonomously learns the structure of the provided time-series data and generates forecasts for the future. The service thereby allows users to choose their preferred model and optimization metrics, with the option to switch to a fully automated selection process (called AutoPredictor). Additionally, users can specify the forecast frequency and horizon, where the horizon is limited to a maximum of one-fourth of the training data length to ensure accurate predictions. The generated forecast can be viewed in the tool for a final assessment and analysis of results.
Amazon Forecast’s pricing structure includes a free tier for the first two months. Subsequent costs primarily depend on factors such as training time and the number of forecast points.
Dataset & Preparation
In our use case, the dataset consists of extracted data from an AWS Cost and Usage Report (CUR) filtered on Amazon RDS. We restricted the timeframe to March 2021 until November 2023. Data of the current month was left out since incomplete months could negatively influence predictions of the model. Usage data aggregation was set to an hourly base.
The attributes used are shown in Figure 1. “pr” stands for “product” and “li” for “line item”.
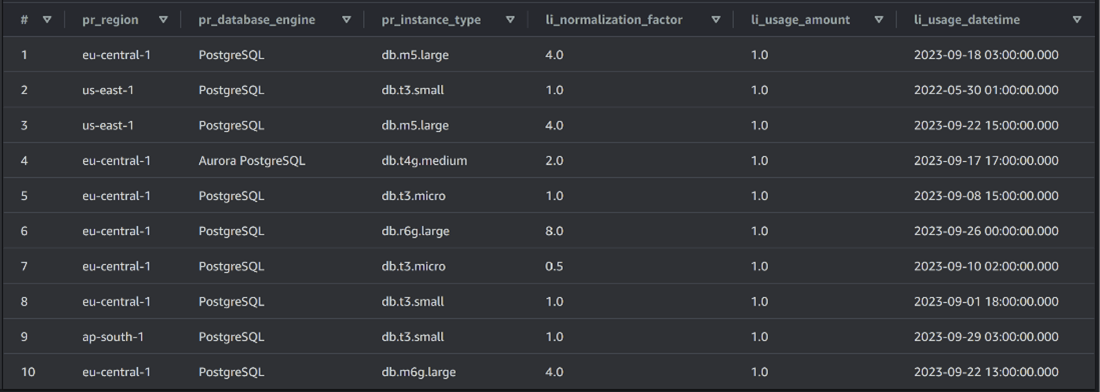
Since our main objective was to identify an optimal purchasing strategy for AWS RDS, the dataset had to be narrowed down to RDS running hours exclusively. Therefore, product families were filtered to database instances only.
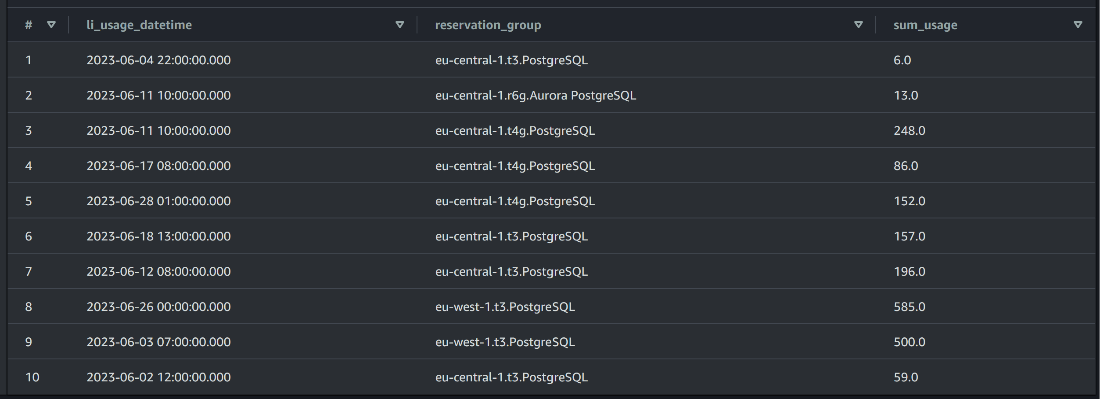
Once the dataset was refined to capture running hours, the next step involved normalization calculations. Normalizing usage becomes imperative due to the significance of instance classes, rather than their size, in relation to RI purchases. This normalization process entailed multiplying the usage amount by the corresponding normalization factor given in the CUR file. Further enhancing the dataset involved grouping reservation configurations into a unified attribute named reservation group. This concatenated string attribute comprises the essential reservation details: region, database engine, and instance family. Afterwards, the data was aggregated by grouping both timestamp and the generated reservation group attribute. This arrangement facilitates a structured dataset, resulting in easier analysis and insights into usage patterns concerning different reservation options over time.
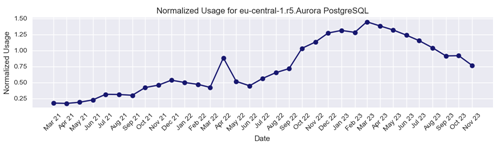
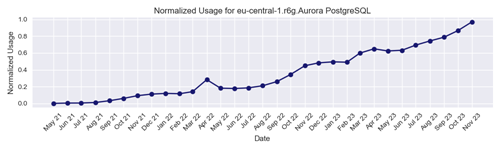
Figure 2 shows our final dataset. Additionally, we visualized the data on a timeline for each individual reservation group.
An example for r5 and r6g Aurora PostgreSQL in the region eu-central-1 are depicted in Figure 3 and 4.
Implementation
After the preparation of our data input, we uploaded the file to an AWS S3 bucket. Amazon Forecast requires the creation of a dedicated container, known as a dataset group, to represent the project. To establish this group, we connected with the data stored in the S3 bucket, confirmed control permissions through a previously initialized IAM role, and provided details about the data schema and time interval.
Following the dataset group setup, we trained a predictor using the default AutoPredictor method, which automatically selects the optimal model for our data. We specified a monthly forecast frequency and requested the tool to provide us with the maximum forecast horizon, set to eight months in our case. We decided to retain the default forecast quantiles—10%, 50%, and 90%—to narrow down predictions within a range of possible true values. Additionally, we kept the default optimization metric.
________________________________
HINT
To forecast a 3-year reservation, we would ideally require data spanning over 12 years. However, this is currently not feasible with the native tools due to the limitations imposed by maximum data history of 38 months in AWS.
________________________________
As a result of these configurations, Amazon Forecast generated CSV files containing time-series forecast values and stored them within our specified S3 data location. Furthermore, the service offers the option to query forecast data by specifying the start and end date of the forecast and providing the ID of a specific item of interest. Following, we investigated the forecast for our ten most important reservation groups.
Result
A first observation from our customer use case is that Amazon Forecast can provide more granular and long-term predictions regarding usage of RDS instances compared to Cost Explorer forecasts. When comparing the predictions to the historical data, we were able to confirm the tool’s ability to capture the monthly trend based on multiple years of fine-grained usage data. However, the machine learning model showed some restrictions in capturing the yearly trend. It slightly averages out decreases and increases in RDS usages, resulting in rather flat forecasting curves.
To provide an example, we have a look at the two reservation groups r5 and r6g for Aurora PostgreSQL in the region eu-central-1. Having a look at their historical course (see Figure 5), we can definitely see a sudden decrease in r5 usage and at the same time another incline in r6g usages from March 2023 onwards. We generally expect that r5 will be substituted by r6g due to instance modernization. The forecast does predict further decrease in r5 and increase in r6g but not as steep as one would expect by looking at the historical data. The middle images in Figure 5 visualize the 10%, 50%, and 90% quantiles forecasted by the model for r5 and r6g.
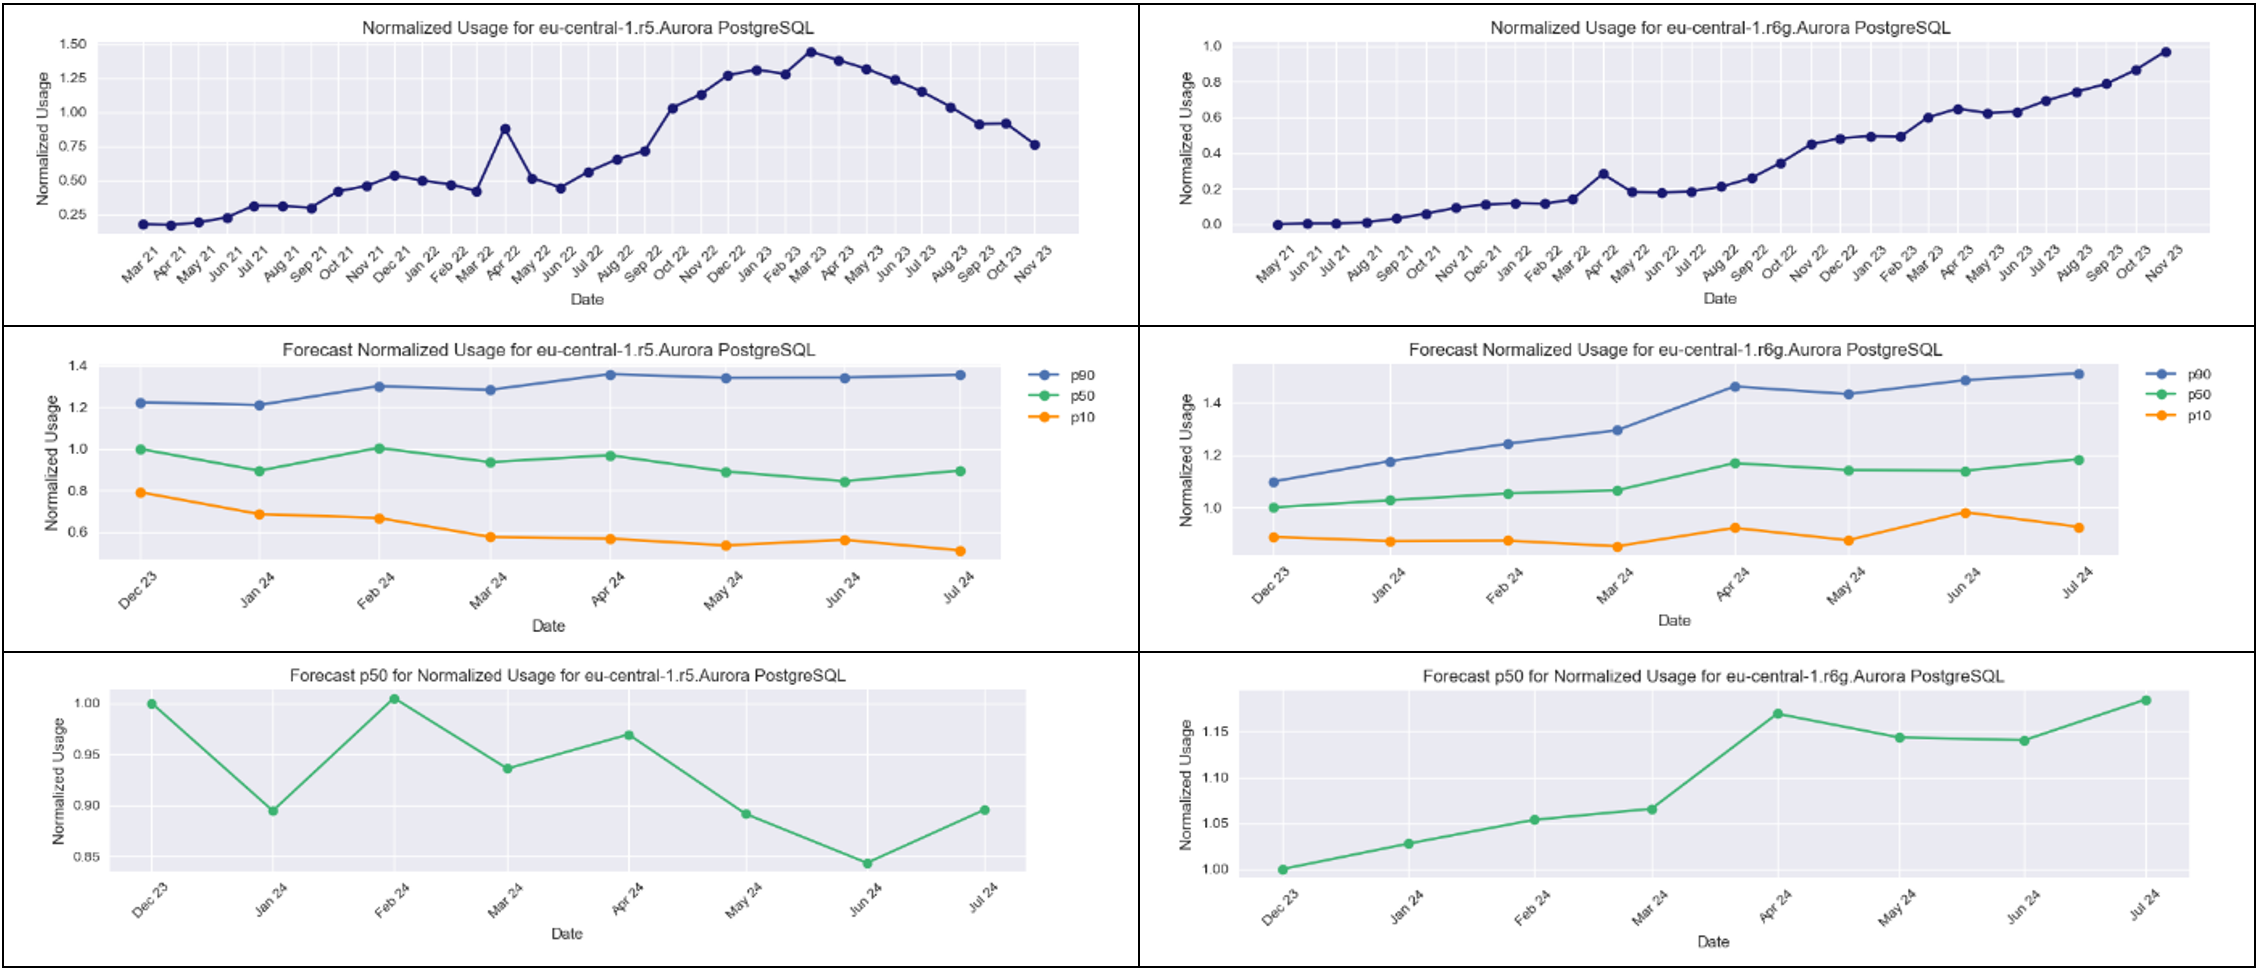
For the r5 case we assume that the model predicted a rather moderate change due to increasing usage values in 2021 and 2022 and then a sudden decrease in March 2023. In the case of r6g, historical data showed an almost linear increase of usages over time. Therefore, the forecast continues this trend correctly.
In addition to the visualization of all three forecast quantiles, we decided to provide a more detailed view of the 50% quantile as a median for forecasted values. In the bottom pictures of Figure 5 the expected decrease in r5 and increase in r6g are easier to recognize. This confirms our hypothesis that r5 will be replaced by r6g in the future.
Finally, we could make another observation. The historical data showed a usage spike in April 2022, resembling an outlier in the input data. Nonetheless, our forecasting model successfully recognized this spike as an outlier without putting too much emphasis on it in the resulting graphs.
Overall, we were able to obtain a plausible prediction result.
Based on the forecast, we can recommend a Reserved Instance purchase. For a low-risk purchase, we would recommend purchasing the 10% quantile (the orange line) of both r5 and r6g (See the middle pictures of Figure 5). Choosing the 10% quantile means that there is a 90% chance that the real usage value per month and year is over the predicted orange line. In addition, we know that r5 will decrease in the future due to resource modernization. Therefore, purchasing the usage linked to the 10% quantile is the safest option.
Conclusio and Outlook
Overall, Amazon Forecast helped us in making reliable predictions for the usage of RDS instances and goes beyond the possibilities of Cost Explorer which bases their recommendations on a very short period of time. In addition, it delivers an immense advantage compared to manual usage analysis. Nonetheless, we expect the model to further improve with even bigger timeframes. Unfortunately, our time-related data did not cover any complete instance lifecycles until now. This would be an interesting feature for further improvement of the AI algorithm. It should lead to the Forecast AI being able to predict their phaseout, e.g. a steeper decrease in r5 due to the modernization to r6g. Similarly, adding a feature for the recognition of predecessor and successor instance families would be of great interest.
Amazon Forecast, as a managed service for easy AI model generation, comes with a few drawbacks. Since training algorithms and hyperparameter tuning are done under the hood, they cannot be configured in much detail. Due to a set ratio of four to one between the training data and prediction timeframe, only eight months could be forecasted. More sophisticated and fine-tuned models, as well as an increased training data timeframe should lead to more precise predictions.
Our case study illustrates the effectiveness of leveraging AI, specifically usage forecasting, to enhance the efficiency of AWS Reserved Instances purchasing. Optimizing costs in Public Cloud Providers' purchasing models demands strategic thinking and many other FinOps capabilities could be enhanced with the use of AI models to make the volatile cost structure of the cloud more predictable and projectable for businesses.
CURIOUS ABOUT THE AUTHORS? CONNECT WITH THEM ON LINKEDIN! MEET VANESSA KANTNER | MEET KIM LINDNER | MEET PAUL ROOCH