Comprehensive Guide to Trivy and Trivy-Operator: From Scanning to Monitoring with Prometheus and Grafana
veröffentlicht am 14.04.2025
von
Ali Sina Bayat
Securing Kubernetes environments goes beyond scanning container images. It involves visibility, automation, and continuous monitoring. Trivy and Trivy-Operator streamline vulnerability management by integrating scanning directly into your cluster operations. In this guide, we'll walk through how to use Trivy for image and configuration scanning, deploy Trivy-Operator for Kubernetes-native insights, and connect everything to Prometheus and Grafana for real-time visibility.
Introduction
Containerized environments and Kubernetes clusters have changed application development and deployment. However, they additionally bring security challenges. That is where tools such as Trivy and its companion, Trivy-Operator, come into play that can effectively perform vulnerability scanning and compliance enforcement. This help teams maintain security without slowing down the development workflows.
Trivy is a cloud native security scanner that allows users to identify security vulnerabilities in their Kubernetes cluster. This approach enables analyzing static resources prior to deployment. However, to ensure ongoing scanning of existing resources within the Kubernetes cluster, the Trivy Operator offers a better solution for automating the scans.
This guide provides a step-by-step approach to install and configure Trivy-Operator, implement automated scanning, and understand the capabilities associated with Trivy and Trivy-Operator.
Set Up a Kubernetes Cluster
Before diving into Trivy-Operator, you need a Kubernetes cluster. For this guide, we will use Minikube. Minikube is a tool that enables you to run Kubernetes locally. If you wish to use a different Kubernetes cluster, feel free to adapt these steps to other Kubernetes environments like kind or managed services like EKS, AKS, or GKE.
Install Minikube
To get started, follow the official Minikube Installation guide for your respective platform (Linux/MacOS/Windows). Make sure that you have also installed Helm, the package manager for Kubernetes, and configured the command-line kubectl tool to manage your cluster.
Start Minikube
You can start your Minikube cluster with a simple command:
minikube start
If you are using any specific driver (e.g., VirtualBox, Docker), change the command and specify it:
minikube start --driver=<NameOfDriver>
What is Trivy-Operator
Trivy-Operator is a Kubernetes operator that leverages Trivy to automate vulnerability scanning and configuration audits of Kubernetes workloads. It follows best practices to continuously monitor and address security issues. Trivy-Operator summarizes the scan results and generates security reports that can be accessed through the Kubernetes API.
Install Trivy-Operator
Trivy-Operator can be installed as Kubernetes manifest using kubectl or through a helm chart. In this guide, we will use Helm for the installation:
1. Add Aqua Security Helm repository:
helm repo add aqua https://aquasecurity.github.io/helm-charts/
The Helm command creates a dedicated namespace named “trivy-system” and installs Trivy-Operator from the Aqua Security repository. You can customize Trivy-Operator by modifying the values.yaml file. For example, the following configuration ensures that Trivy should only report the vulnerabilities that already have a fix:
trivy:
  ignoreUnfixed: true
You can also customize the values in another way like setting the appropriate flag directly in the Helm command:
Once Trivy-Operator is installed, verify the installation with the following command which lists all the resources created by Trivy-Operator:
kubectl get all -n trivy-system
Automated Vulnerability Scanning
To automate vulnerability scanning in running containers, ensure that Trivy-Operator watches for new deployments and scans them accordingly. For this purpose, let’s create a vulnerable nginx deployment imperatively and observe the automated scanning process.
Trivy-Operator automatically scans the deployment after creation, generating reports such as VulnerabilityReport and ConfigAuditReport.
3. View the reports
kubectl get vulnerabilityreports -n nginx -o wide
kubectl get configauditreport -n nginx -o wide
The reports are created for each different container. Since we only have one container, the reports are created for the one existing container. Each report provides detailed insights into vulnerabilities, misconfigurations, or other issues associated with the deployed resources.
Visualize Trivy-Operator Metrics in Grafana
In this part we will walk through and set up the Trivy-Operator to forward metrics to Prometheus, and then viewing those metrics in Grafana.
Installing Prometheus and Grafana
The easiest way to install Prometheus and Grafana is by using the kube-prometheus-stack helm-chart.
1. Create a Namespace:
First create a namespace in which we install the Prometheus and Grafana resources.
3. Customize Prometheus to Discover ServiceMonitors:
The Prometheus installation needs a minor customization to be able to discover ServiceMonitors by default. This tells Prometheus to look for all ServiceMonitors in all namespaces without requiring any particular labels. For this purpose, we will create a values.yaml file with the following configuration:
prometheus:
  prometheusSpec:
    # Allows overriding the default Helm value
    serviceMonitorSelectorNilUsesHelmValues: false

    # Select all ServiceMonitors regardless of label
    serviceMonitorSelector: {}
    # Watch for ServiceMonitors in all namespaces
    serviceMonitorNamespaceSelector: {}
4. Install Prometheus and Grafana
Install the kube-prometheus-stack using the customized values file:
Now that we have installed the Prometheus stack, we have to modify Trivy-Operators values.yaml file to enable its ServiceMonitor. The ServiceMonitor is required in order for Prometheus to be able to detect the Trivy’s Service and scrape its metrics. We also ensure its service has a ClusterIP (not headless):
Now that everything is set up, we will check if Prometheus is collecting the metrics and visualize them in Grafana.
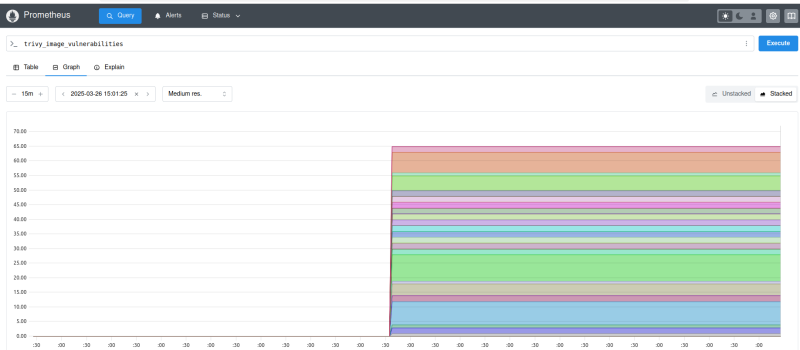
Accessing the Prometheus Dashboard
Open a browser and go to http://localhost:9090. In the Prometheus UI search for Trivy in the expression field in order to verify that the Trivy-Operator's metrics are being collected. If everything works well, you should see metrics related to security vulnerabilities.
Creating Dashboard for Trivy-Operator Metrics
Now, we will build a Grafana dashboard to visualize the Trivy-Operator's metrics.
Open a new browser tab, and go to http://localhost:3000. The default credentials are:
Username: admin
Password: prom-operator (or extract the password using kubectl get secret -n monitoring prom-grafana -o jsonpath="{.data.admin-password}" | base64 --decode)
Adding a New Panel
In Grafana, go to Dashboards > New Dashboard.
Click Add visualization
Select Prometheus as the data source.
In the Query Editor, use the following queries to get useful insights.
Total Vulnerabilities
sum(trivy_image_vulnerabilities)
Total Misconfiguration
sum(trivy_resource_configaudits)
Exposed Secrets discovered by the Trivy Operator
sum(trivy_image_exposedsecrets)
Top Vulnerable Namespaces
topk(5, sum by (namespace) (trivy_image_vulnerabilities))
Clean Up (Optional)
Once you have visualized the metrics and no longer need the deployed resources, you can clean them up.
kubectl delete deploy nginx -n nginx
By deleting the deployments, the associated reports are automatically removed by Kubernetes garbage collection controller.
Trivy's Scanning Capabilities
Trivy provides various scanning capabilities:
Container Images
Trivy scans Docker and OCI images. It analyzes files inside the container images and container image metadata. Trivy scans those files for vulnerabilities, misconfigurations, secrets, and licenses. By default, Trivy performs vulnerability and secret scanning. By specifying the image name and the image tag, Trivy analyzes the image and detects known vulnerabilities in the specified image by utilizing a database containing vulnerability information. This database is built every six hours on GitHub and it is distributed via GitHub Container Registry (GHCR).
trivy image [YOUR_IMAGE_NAME]
You can configure Trivy to exclusively focus on a specific type of issue, such as vulnerabilities, misconfigurations, secrets, or licenses. To customize the scan, use the --scanner flag:
trivy image --scanners vuln [YOUR_IMAGE_NAME]
Container images contain metadata. Trivy is capable of scanning metadata for misconfiguration or secrets. These scans are disabled by default but can be enabled by setting the --image-config-scanners flag:
Trivy supports image scanning from different sources. By default, it will start looking for the specified image in the local Docker Engine, then Containerd, Podman, and finally the container registry. You can customize the default behavior:
Trivy analyzes local filesystems to identify several security issues. Trivy performs vulnerability and secret scanning by default, but it can also detect misconfigurations and license issues.
To scan a local directory, execute the following command:
trivy fs /path/to/project
Trivy can also scan individual files for vulnerabilities:
trivy fs /path/to/file
Trivy supports further types of scanners, which could be enabled using the --scanner flag. For example, enabling misconfiguration scanning:
trivy fs --scanners misconfig /path/to/project
Code Repositories
Trivy is capable of scanning local and remote code repositories to identify security issues. By default, it analyzes the repos for vulnerabilities and secrets.
trivy repo (REPO_PATH | REPO_URL)
For example, you can scan a local repository as follows:
trivy repo ./
To scan a remote code repository, specify the repository URL:
Trivy can also analyze Kubernetes manifests for misconfigurations and insecure policies, as well as private repositories, particular branches, commits, or tags. To scan a particular part of a repository, use the --branch, --commit, or --tag parameters.
Features, Security, and Compliance Mapping
The Trivy-Operator builds upon Trivy’s core capabilities, enabling automated security and compliance scans within a Kubernetes cluster. It automatically detects changes and generates different types of reports based on workload and cluster components.
Security & Infrastructure Scan Reports:
Vulnerability Report: Automated vulnerability scanning to detect issues in workloads.
Configuration Audit Report: Automated configuration audits for detecting flag misconfiguration or custom rules.
Exposed Secret Report: Automated secrets scan to find and report leaked sensitive data within the cluster.
RBAC Assessment Report: RBAC scan to evaluate and provide information about the installed resources permissions.
Trivy and Trivy-Operator also support automated compliance scanning to help organizations meet industry standards. By default, the Trivy-Operator performs compliance scans every six hours, but this behavior can be modified. The following reports are available out of the box:
CIS Kubernetes Benchmark: Ensures cluster configuration aligns with security best practices.
Kubernetes Pod Security Standards: Workload validation against restricted policy.
Avoiding Common Pitfalls in Container Security Scanning
Setting up container image scanning with Trivy is an important first step in securing your Kubernetes workloads. However, even with automated scanning, teams often encounter common pitfalls that reduce the overall effectiveness of their security efforts. Here are some common pifalls and how to avoid them:
Ignoring Low and Medium Severity Issues Focusing only on critical vulnerbailities and ignoring low and medium severity issues could end badly. Attackers often chain together several small vulnerabilities to create a serios exploit. It is recommended that you track all vulnerabilites using severity-based alerts, and not only the critical ones.
Forgetting to Scan Base Images Most vulnerabilites are in base image, so avoid just focusing on the application layer. Scanning the base image should be part of the pipeline. This will ensures that images are scanned and updated regularly.
Not Acting on Findings Even with a scanning pipeline in place, findings often end up being ignored if there isn't a clear process in place. There should be a clear vulnerability management workflow, such as how findings are tracked, who ist notified if there is a finding, what is the SLA for fixing the issue etc.
Minimal Runtime Protection Image scanning only protects when containers are deployed. Containers are left unprotected at runtime and do not catch unauthorized changes. To avoid this, use content-aware firewalls, monitor containers for anomalous actions, regularly check the configs for misconfigurations and use runtime threat detection tools like Falco.
Vulnerable Container Registry Unprotected registries are rewarded targets and put the entire container pipeline at risk. If one compromises the registry, the key to infect each and every image is in her hand. To avoid this, prevent unauthorized access, avoid unencrypted network and use TLS certificates.
Conclusion
This guide showed how Trivy-Operator simplifies container and Kubernetes security through automated scanning and detailed security reporting. It also showed how to visualise the metrics using Prometheus and Grafana. In addition, it explained the capabilities of both Trivy and Trivy-Operator, highlighting their features, security scanning, and compliance mapping. By using these tools, you can ensure that your workloads are secure and gain insight into potential risks. Also, check out the official documentation for Trivy and Trivy-Operator to deep dive into the topic and make your Kubernetes environment more secure.