
Building an eBPF based Open-Source observability platform
veröffentlicht am 09.03.2025 von Max Schmidt
In today's world maintaining Observability and understanding what is happening inside your system in near real-time is a challenging task. The complexity arises due to the distributed nature of Cloud Infrastructure and especially Microservice based Software that has multiple components that need to communicate between each other. Keeping track of this communication and the processes involved is time consuming to track on its own.
Using the extended Berkeley Packet Filter (eBPF) technology helps transform Observability itself by allowing deep, safe, and efficient instrumentation of running systems.
What is eBPF?
eBPF was originally developed as a packet filtering technology for the Linux Kernel. However, as time has passed it evolved into a general-purpose technology that allows to run sandboxed programs within the Operating Systems Kernel. That means – for observability – eBPF can be used by observability tools to attach to multiple events such as system calls, function entry and exit points and network events.
How eBPF enhances Observability
eBPF programs are running within the kernel itself, thus it allows us to gather data with a minimal performance overhead. That is especially important in highly available, low latency cloud environments.
Additionally for classic observability developers had to adapt the Code to instrument the application and make it observable. EBPF on the other hand allows for dynamic instrumentation of several programming languages without adapting the applications source code or even restarting the Application.
Since eBPF Programs run on kernel-level they can access context data like CPU Usage, Memory Allocation, Input and Output Operations and network activity specific to the application itself.
EBPF Security
Since running programs on a Kernel Level might result in crashes of the entire system, the Linux Kernel is introducing the eBPF Verifier which will prevent eBPF Programs from being loaded into the Kernel space if they are not passing the validations. For this the verifier is performing Static Analysis, Sanity Checks, Security Checks and Safety Checks to make sure the eBPF program is Memory Safe and does not compromise the kernels security by leveraging privilege escalation or even accessing unauthorized kernel memory. If any of these checks fail, the program will not be loaded into the Kernel.
Additionally, to the mentioned measures, eBPF programs run in a sandboxed environment so they can only interact in a controlled manner in pre-defined ways.
EBPF Observability Tools
The Grafana ecosystem, known for its powerful visualization and monitoring solutions, has integrated eBPF-based tools to provide comprehensive observability across cloud-native environments. Here’s a look at some of the key tools in this ecosystem:
- Grafana Alloy
Description: Grafana Alloy is the latest open-source observability agent that has replaced Grafana Agent. Alloy is designed to efficiently collect metrics, logs, profiling data and traces from various sources, with native support for eBPF-based data collection. By leveraging eBPF, Alloy can gather detailed system-level metrics directly from the kernel, offering high-resolution insights into performance and behavior. - Grafana Pyroscope
Description: Grafana Pyroscope is a continuous profiling tool that has replaced Grafana Phlare. It captures and analyzes performance profiles from applications, using eBPF to gather detailed data on CPU usage. Pyroscope allows users to visualize profiling data alongside other observability metrics within Grafana, offering a unified view of system and application performance. The capturing of memory data using eBPF is not supported as of now. - Grafana Beyla
Description: Grafana Beyla is a recently introduced tool that leverages eBPF to provide observability for application requests and their impact on system performance. Beyla captures detailed metrics related to application requests, including latency, errors, and resource consumption, directly from the kernel using eBPF.
This data is then correlated with other observability signals within the Grafana platform, providing a comprehensive view of application behavior and performance.
Beyla is essentially useful as a startingpoint for Auto-Instrumenting applications as it will provide RED (Rate Errors Duration) metrics and also Tracing telemetry.
Observability Pipeline using OpenTelemetry
An observability pipeline is essential for managing the flow of telemetry data across complex distributed systems. OpenTelemetry (OTel) is an open-source framework that provides a standardized approach to capturing and exporting telemetry data—including metrics, traces, and logs—from applications and infrastructure. In an eBPF-powered observability setup, OpenTelemetry can be used as the backbone of the observability pipeline, ensuring a streamlined data flow across tools and platforms.
Key Components of an OpenTelemetry-Based Observability Pipeline
- Data Collection: The pipeline begins with data collection using eBPF and OpenTelemetry. eBPF provides system-level metrics and application insights without requiring changes to application code. OpenTelemetry collects telemetry data from both eBPF sources and application-level instrumentation, ensuring a unified view of system performance.
- Data Processing: Once data is collected, it is processed to standardize formats, enrich the data with context, and filter out any noise. This stage may involve processing tools within OpenTelemetry, such as the OpenTelemetry Collector, which serves as a central agent for ingesting and processing telemetry data from diverse sources.
- Data Export: The processed data is then exported to one or more observability platforms, such as Grafana, Prometheus, or Dynatrace. OpenTelemetry supports a wide range of exporters, allowing data to be directed to multiple backends for analysis and visualization. Exporting data in real-time enables near-instant insights, while also allowing data to be stored for historical analysis.
Benefits of Using OpenTelemetry in an eBPF Observability Pipeline
- Interoperability: OpenTelemetry’s support for diverse data formats and observability backends enables seamless integration with both open-source and commercial tools, creating a flexible observability ecosystem.
- Scalability: By consolidating telemetry data in a standardized pipeline, OpenTelemetry allows for the observability system to scale with the infrastructure, maintaining performance even in high-throughput environments.
- Enhanced Insights: Combining OpenTelemetry’s application-level visibility with eBPF’s kernel-level insights provides a full-stack view of system behavior, leading to faster troubleshooting and performance optimization.
Putting it together
With the previous knowledge it is now clear what eBPF is, what it is doing and why it provides a big benefit. To now make use of this technology for a sample Observability Setup, we will deploy a Observability Platform for a Kubernetes Cluster. This platform consists of:
- Grafana Alloy (OpenTelemetry distribution with eBPF capabilities)
- Grafana Beyla (eBPF)
- Grafana Pyroscope (eBPF)
- Grafana Loki (Logs)
- Grafana Mimir (Metrics)
- Grafana Tempo (Traces)
- Grafana Pyroscope (Profiling)
- Grafana (Visualization)
In this setup we use Grafana Alloy as an OpenTelemetry based Agent which is responsible for handling our Observability Pipeline. Grafana Alloy can incorporate Beyla eBPF to automatically retrieve Traces from running processes on the Kubernetes Nodes. Pyroscope also offers an eBPF module which extracs CPU Profiles from running C/C++, Go or Rust applications. In general natively compiled applications are supported by Pyroscope eBPF.
Alloy Data Flow
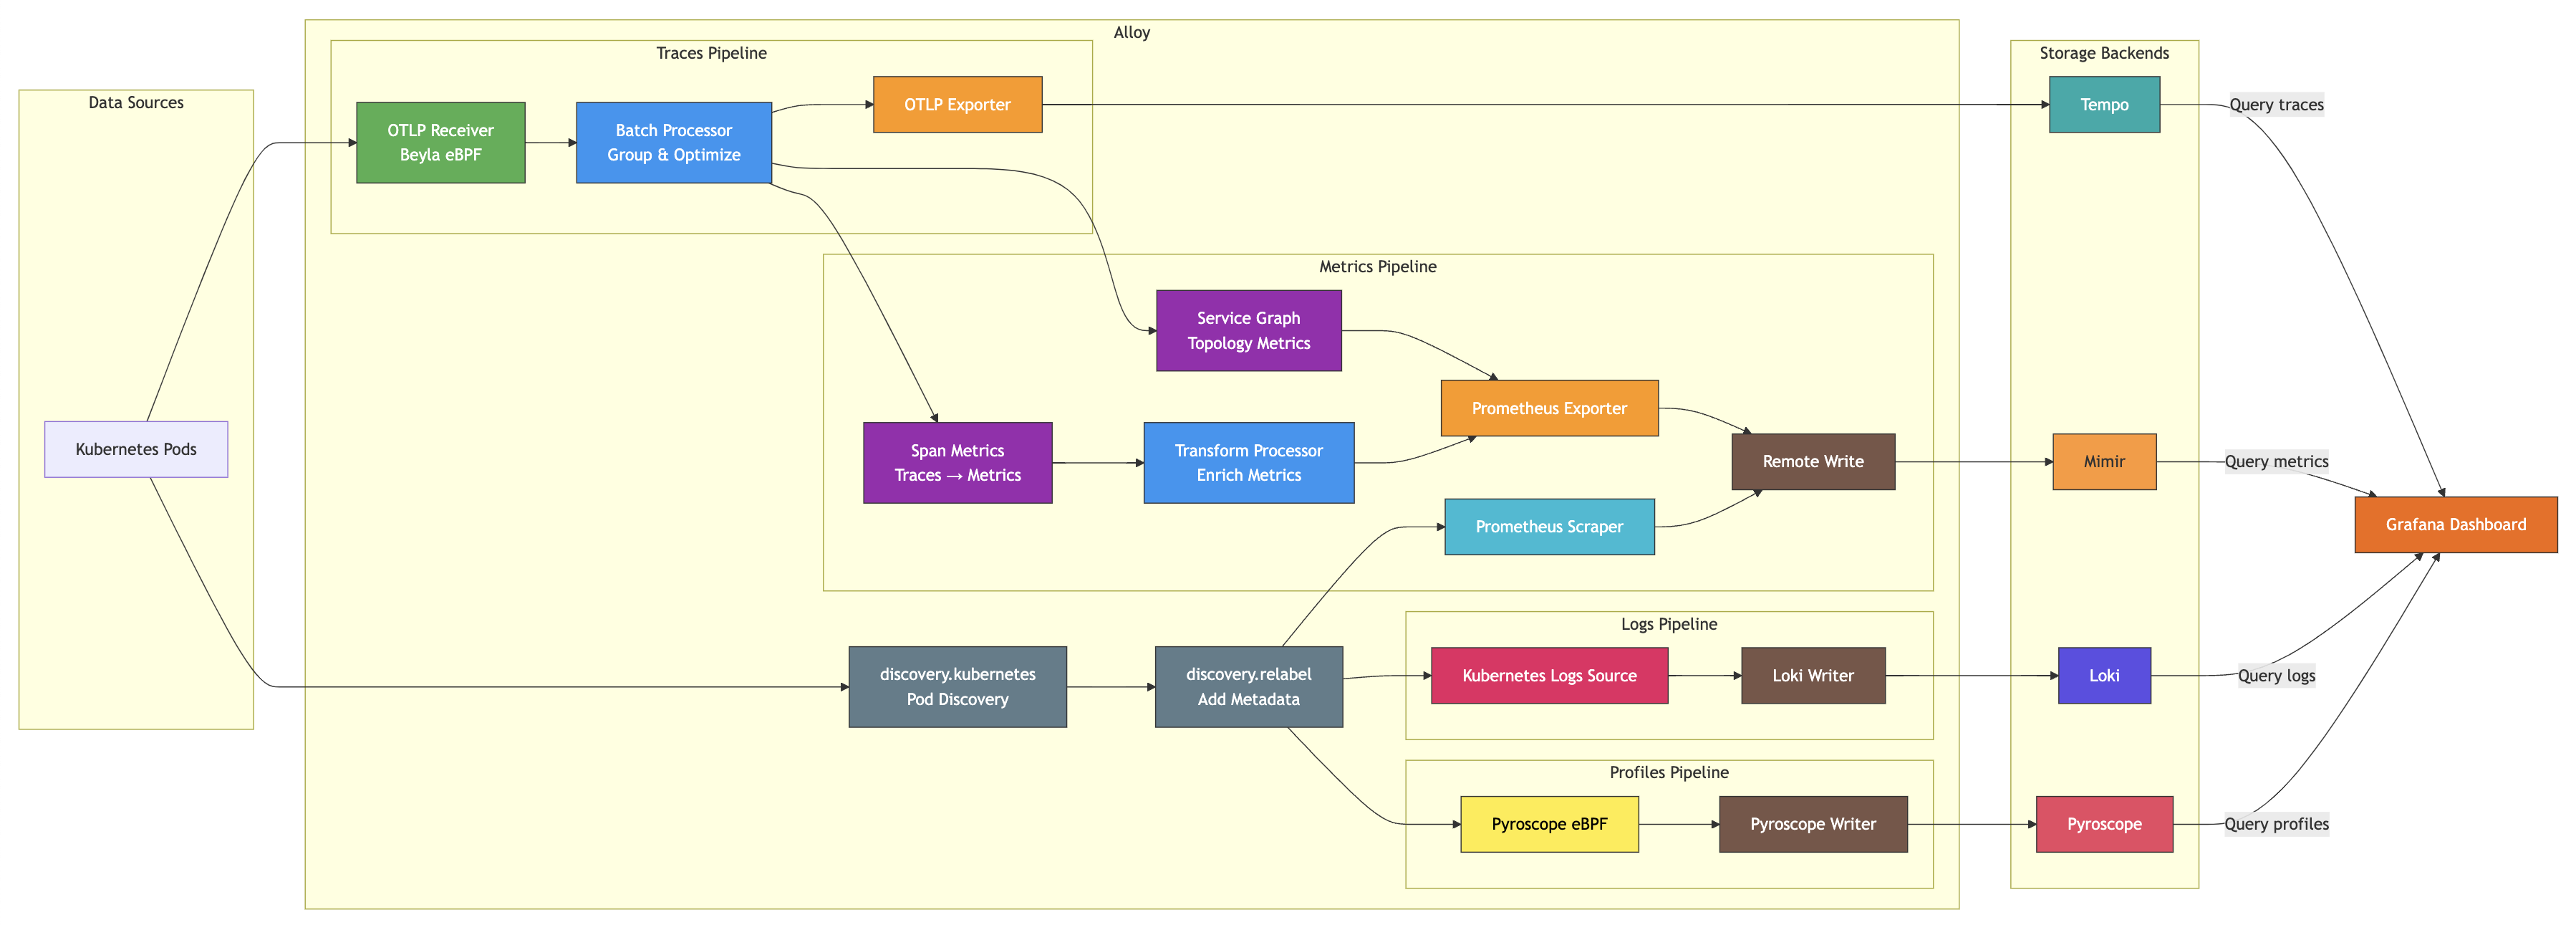
Discovery:
- Kubernetes pods are discovered and enriched with metadata
Collection:
- Traces are collected via OTLP or auto-instrumentation with Beyla
- Metrics are scraped from pods
- Logs are collected from pod stdout/stderr
- Profiles are collected using eBPF
Processing:
- Traces are batched for efficiency
- Traces are converted to metrics via span metrics
- Traces are used to generate service topology
- Metrics are transformed and enriched
Export:
- Traces are exported to Tempo
- Metrics are exported to Mimir
- Logs are sent to Loki
- Profiles are sent to Pyroscope
Visualization:
- Grafana queries all backends to create unified dashboards
Alloy Configuration Components
Discovery Components
- discovery.kubernetes.k8s_pods: Discovers Kubernetes pods
- discovery.relabel.local_pods: Relabels discovered pods with metadata
Traces Collection
- otelcol.receiver.otlp.default: Receives traces via OTLP protocol
- beyla.ebpf.beyla: Automatically instruments applications using eBPF
- tracing: Configures trace sampling
Processors
- otelcol.processor.batch.beyla: Batches traces for efficient processing
- otelcol.processor.transform.default: Transforms metrics data
Connectors
- otelcol.connector.spanmetrics.default: Converts traces to metrics
- otelcol.connector.servicegraph.default: Generates service topology from traces
Exporters
- otelcol.exporter.otlphttp.beyla: Exports traces to Tempo
- otelcol.exporter.prometheus.default: Exports metrics in Prometheus format
Metrics Collection
- prometheus.scrape.demo: Scrapes metrics from Kubernetes pods
- prometheus.remote_write.default: Sends metrics to Mimir
Logs Collection
- loki.source.kubernetes.pods: Collects logs from Kubernetes pods
- loki.write.local: Sends logs to Loki
Profiles Collection
- pyroscope.ebpf.local_pods: Collects profiles using eBPF
- pyroscope.write.endpoint: Sends profiles to Pyroscope
Kubernetes Deployment
Now the concepts and different responsibilities of the components required to setup a holistic eBPF based observability platform are known. The next step is setting up the needed tools on a Kubernetes cluster. For this an example Helm Chart is provided in a GitHub Repository.