
All articles
LLMOps Observability: Infrastructure, Runtime, Analytics
LLMOps observability extends far beyond monitoring model endpoints. This article examines key capabilities across three connected layers - infrastructure, runtime, and analytical observability - and explains how they help engineering teams assess platform health, investigate individual requests, and determine whether an LLM system is improving over time.
·
Lino Deppe

Observability Beyond Traditional Monitoring
Earlier articles examined the hardware decisions that define an AI strategy and the deployment decisions involved in serving LLMs in production. Once such a system is running, teams need to know two things: whether it is working, and why it behaves the way it does. The usual starting point is traditional monitoring, which answers predefined questions: Is the endpoint available? Is latency within its service-level objective? Has the error rate crossed an alert threshold? LLMOps observability goes further and connects infrastructure, runtime, and analytical evidence.
Those signals remain essential, but they cannot fully explain whether an answer was grounded in the retrieved context, why an agent entered an expensive tool loop, or whether a model change reduced task completion.
Monitoring tracks known conditions through predefined metrics, dashboards, and alerts. Observability provides the evidence needed to investigate unexpected behaviour by correlating metrics, logs, traces, evaluations, configurations, and outcomes.
Tracing is one part of that evidence: it reconstructs the path of a request across model calls, retrieval, tools, guardrails, retries, and other components. Evaluation assesses properties such as groundedness, relevance, safety, or task success, either for an individual response or across a larger dataset. Neither tracing nor evaluation alone constitutes observability; their value comes from being connected to operational telemetry, configuration, and outcomes.
In this article, LLMOps observability refers to this broader operational scope, extending LLM observability to include the infrastructure and analytical practices required to operate and improve LLM systems in production. This evidence spans three complementary layers:
Infrastructure observability: Is the platform healthy and cost-efficient?
Runtime observability: What happened during this request?
Analytical observability: Is the system improving or degrading over time?
These layers are not isolated technology tiers. They operate at different granularities and timescales, forming a path from the infrastructure underneath the system, through live request execution, to the analytical evidence guiding future improvements.
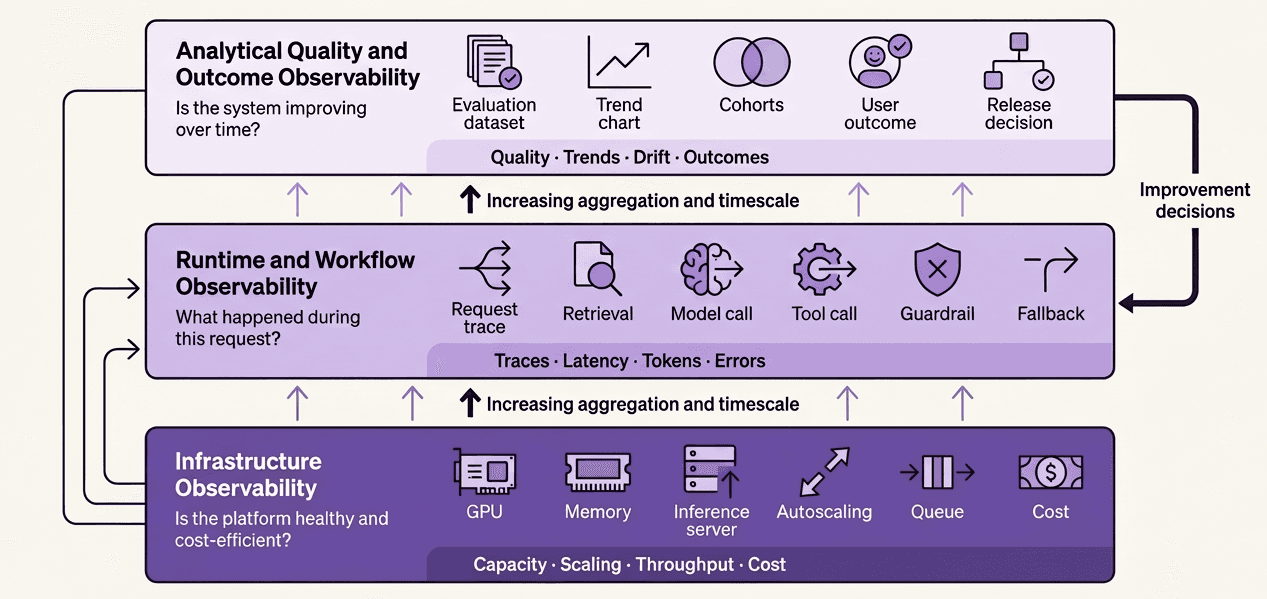
Figure 1: The three connected layers of LLMOps observability
Layer 1: Infrastructure Observability
The infrastructure layer asks: Can the platform serve the workload reliably, efficiently, and at an acceptable cost?
For self-hosted inference, relevant signals include GPU utilisation and saturation, GPU memory and key-value cache usage, request and token throughput, queue depth, prefill and decode performance, and batching efficiency. Autoscaling behaviour and cold-start latency indicate whether capacity can follow demand without creating unacceptable delays or unnecessary expense.
Hardware telemetry can reveal problems that application-level metrics cannot explain. Temperature, power limits, thermal throttling, error-correcting code errors, and device-level faults may all affect serving performance or availability.
Average GPU utilisation should not be interpreted in isolation. Low utilisation may indicate overprovisioning, but it can also result from insufficient batching, slow retrieval, CPU bottlenecks, or bursty demand. High utilisation may be acceptable until it causes queue growth or breaches a Time to First Token (TTFT) objective.
The useful unit of analysis is a correlated set of signals. For example, increasing queue depth combined with stable request throughput and saturated GPU memory suggests a different constraint from low GPU utilisation combined with slow upstream retrieval.
Cost attribution belongs in this layer as well. GPU-hours and infrastructure expenses should be attributable to workloads, models, teams, or products rather than remaining an undifferentiated platform bill.
Platform Engineering and Site Reliability Engineering typically own this scope in cooperation with model-serving teams. GPU exporters, inference-server metrics, orchestrator and cloud dashboards, cost systems, and resource metadata provide the raw telemetry, but the essential capability is correlation between hardware conditions, serving behaviour, and workload identity.
With managed model APIs, much of this infrastructure telemetry remains with the provider, shifting the customer’s focus towards quotas, rate limits, regional availability, latency, and cost.
Example Infrastructure Tooling
The following are representative examples rather than a prescribed stack. The required capabilities should be defined before selecting specific products.
Tool or standard | Relevant capability |
NVIDIA DCGM Exporter and Prometheus | Collect GPU utilisation, memory, power, temperature, and hardware-health telemetry. |
Triton, vLLM, or equivalent serving tools | Expose metrics for throughput, queue latency, cache utilisation, and batching efficiency. |
Kubernetes and cloud GPU dashboards | Provide workload health, autoscaling, capacity, and infrastructure-cost visibility. |
OpenTelemetry resource metadata | Correlate serving workloads with the infrastructure resources on which they execute. |
Layer 2: Runtime and Workflow Observability
The runtime layer asks: What happened during this request, and why?
An LLM application should be observed as a distributed workflow rather than as a single model API call. One user request may involve prompt assembly, retrieval, reranking, several model invocations, tool execution, guardrails, retries, fallbacks, and response processing. A successful HTTP response does not show which stage dominated latency, consumed the token budget, or produced an unsuitable result.
Distributed traces should therefore represent the complete execution path. Relevant signals include end-to-end latency, error rate, TTFT, inter-token latency or output-token throughput, input and output token counts, stop reasons, truncation, timeouts, rate limits, cancellations, retries, and cost per request or workflow.
Retrieval introduces additional signals such as latency, result count, zero-result rate, and reranking behaviour. Agentic workflows require visibility into tool-call latency and success, repeated steps, amplification, termination reasons, guardrail decisions, and fallback activation.
A trace also needs enough configuration context to make the execution diagnosable and comparable across releases. This includes the model and provider, prompt or agent version, retrieval-index version, deployment version, relevant inference settings, tool calls, retries, and fallbacks. Without that context, a trace may show where time was spent but not explain why behaviour changed between releases.
Not every evaluation belongs on the synchronous request path. Deterministic schema or format validation can often run inline, while safety-critical guardrails may need to block a response before it reaches the user. More expensive model-based evaluations are usually better executed asynchronously on sampled traffic, with heavier sampling for failures, anomalies, negative feedback, and new deployments.
Runtime observability supports immediate operational decisions: alert, retry, activate a provider or model fallback, open a circuit breaker, return a degraded response, or escalate to a human. Its main users are application teams, platform engineers, SREs, and engineers carrying on-call responsibility.
Telemetry design must also address privacy and cardinality. Prompts and responses may contain personal, confidential, or regulated information, so production systems need deliberate redaction, access controls, retention policies, and sampling. High-cardinality identifiers such as request, conversation, and user IDs belong in traces rather than metric labels.
Example Runtime Tooling
These examples illustrate different approaches to instrumentation, workflow tracing, debugging, and telemetry correlation. Some products span more than one observability layer.
Tool or standard | Relevant capability |
OpenTelemetry GenAI conventions | Provide vendor-neutral instrumentation and shared context for LLM workflow traces. |
LangSmith | Supports trace-level inspection of LLM chains, agents, model calls, and tools. |
Arize Phoenix | Provides open-source tracing, evaluation, and debugging for LLM applications. |
Datadog LLM Observability | Correlates LLM workflows with application and infrastructure telemetry. |
Layer 3: Analytical Quality and Outcome Observability
The analytical layer asks: Is the system’s quality, safety, cost efficiency, and impact improving or degrading over time?
This layer combines sampled production traces, controlled evaluation datasets, user feedback, and product metrics. Its unit of analysis is a dataset, cohort, release, or period rather than an individual request.
Common techniques include golden-set regression tests, which rerun a curated set of representative inputs and expected behaviours after a change to detect quality regressions, as well as human review and model or prompt comparisons. Teams may also use groundedness scoring (whether responses are supported by the available source material) and relevance scoring. Canary and shadow evaluations help assess changes before a full release. Automated evaluations may also require judge calibration to ensure that LLM-based scoring remains reliable and aligned with human assessments.
Production results can be segmented by task, tenant, language, document category, model version, or retrieval strategy. Correction rates, regenerations, task completion, human escalation, and cost per successful task connect technical measurements to user and product outcomes.
Drift detection belongs here, but drift is an investigative signal rather than an automatic failure. A change in input data, concepts, or output distributions becomes operationally meaningful when it correlates with declining quality, safety, cost efficiency, or user outcomes.
Evaluation results also require versioning. Each result should identify the evaluated model and prompt, dataset or production sample, judge model and judge prompt, rubric, retrieval index, tool and token budgets, and relevant retry and inference settings. Otherwise, an apparent improvement may have been caused by changing the evaluator rather than improving the application. Model-based judges should therefore be calibrated against human assessments rather than treated as unquestionable ground truth.
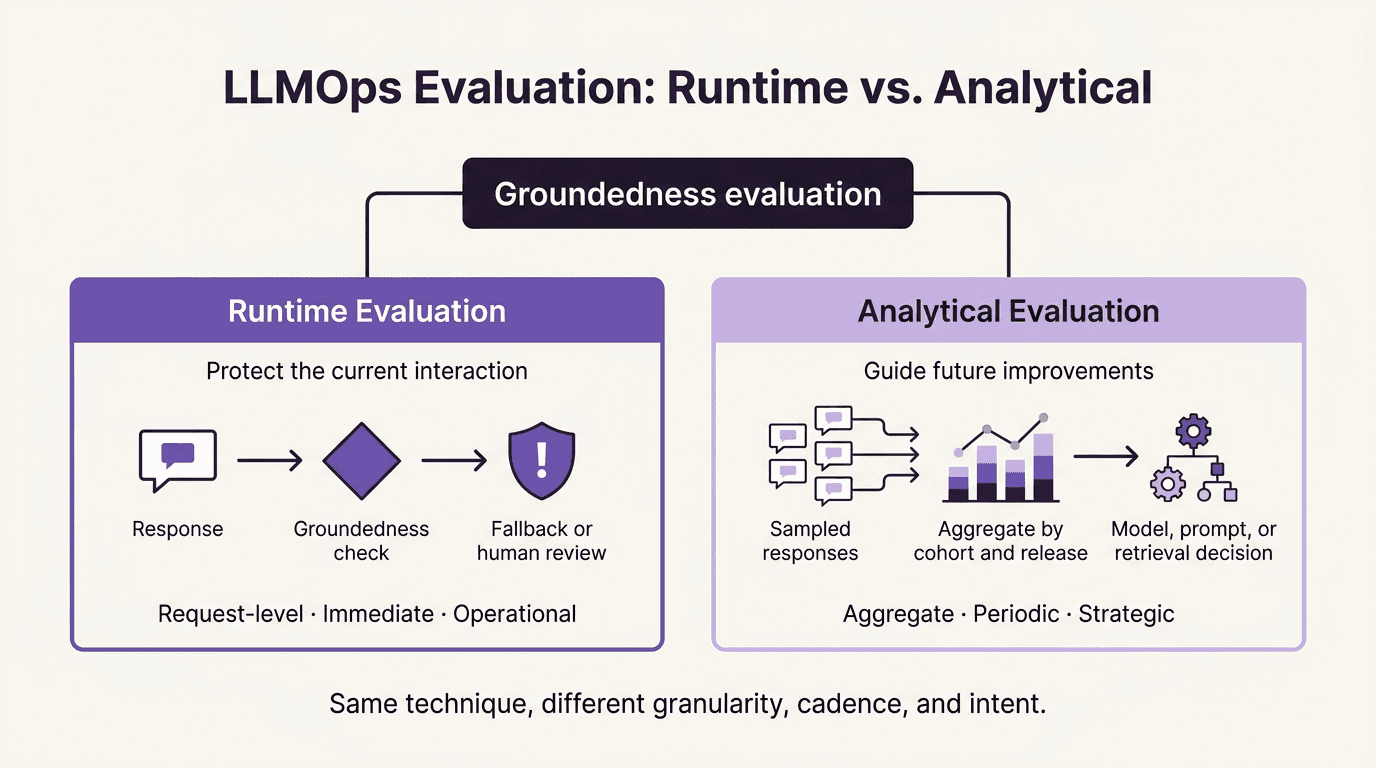
Figure 2: Groundedness Evaluation: Runtime vs. Analytical
Runtime and analytical evaluation may use the same technique, but they support different decisions. A request-level groundedness check can trigger a fallback or human review, while aggregated groundedness scores can reveal regressions across releases, prompts, models, or document categories.
The distinction lies in granularity, cadence, and intent. Runtime evaluation is request-level and immediate, with the aim of protecting users and service reliability. Analytical evaluation is aggregate and periodic, with the aim of guiding model selection, prompt revisions, retrieval improvements, guardrail changes, and release decisions.
Ownership consequently broadens to technical leads, ML engineers, architects, product owners, and governance stakeholders.
Example Analytical Tooling
These examples cover evaluation, drift analysis, production monitoring, and domain-specific benchmarking. They should be assessed against the required evaluation methods, governance controls, integration model, and deployment constraints.
Tool or platform | Relevant capability |
Evidently | Produces evaluation reports and supports data- and model-drift analysis. |
Arize | Supports production monitoring and cohort-level performance analysis. |
WhyLabs | Provides data profiling, drift detection, and model-performance monitoring. |
Custom evaluation pipelines | Implement domain-specific benchmarks, quality metrics, release gates, and governance controls. |
Implementation Perspective: Where Kubernetes Fits
The three layers define what teams need to observe, not the platform on which observability must be implemented. Kubernetes is neither a prerequisite nor an observability solution in itself, but it can provide a consistent operational foundation where it is already in use.
At the infrastructure layer, Kubernetes metadata such as namespaces, labels, annotations, and service accounts can give workloads a stable identity. When included in telemetry as resource attributes, this metadata makes it easier to associate GPU consumption, serving behaviour, cost, and reliability signals with particular models, teams, environments, and releases. Device plugins allow Kubernetes to treat GPUs as schedulable resources, while autoscalers can respond to inference-related signals. Scaling nevertheless remains constrained by factors such as provisioning, model loading, and data movement.
At the runtime layer, OpenTelemetry Collectors can provide a common pipeline for enriching, filtering, and exporting telemetry from different workloads. Applications still require deliberate instrumentation for model calls, retrieval, tools, retries, and evaluations. Version-controlled deployments also make releases identifiable, helping teams correlate behavioural changes with specific application, configuration, or model-serving changes and, where necessary, roll them back.
Kubernetes controls can also support telemetry governance. Role-based access control (RBAC) limits who can access resources, while network policies, secret management, namespaces, and resource quotas help isolate sensitive telemetry and prevent evaluation workloads from competing with production inference for capacity.
For analytical observability, Kubernetes Jobs and scheduled CronJobs can execute regression tests and recurring evaluations. Connected to CI/CD pipelines, their results can support release gates, but Kubernetes does not define the datasets, scoring criteria, or acceptance thresholds.
Platform teams can package these capabilities as self-service abstractions, giving application and ML teams consistent instrumentation, access controls, and evaluation workflows by default.
Build by Decision, Not by Tool
Kubernetes illustrates how a platform can support the three observability layers, but the platform should follow from the operational decisions that teams need to make, not determine them. Teams also do not need equal maturity across all three layers from the outset. They should begin with the decisions their observability system must support:
Can the platform team diagnose capacity, scaling, and cost problems?
Can an on-call engineer reconstruct a failed workflow?
Can technical leadership determine whether a release improved quality and user outcomes?
The objective is not three disconnected dashboards. It is a correlated evidence chain that connects infrastructure conditions, request execution, model behaviour, and product outcomes. This connection allows a latency regression, cost increase, or quality decline to be investigated as part of the same system rather than in separate operational silos.
Build your observability architecture around the decisions your teams need to make, not the tools available on the market. Define the questions, owners, timescales, and operational responses first, then select the technologies that best support them.
Need Help Building Your LLMOps Observability Platform?
At Liquid Reply, we help engineering teams design and implement production-grade platforms for LLM workloads. Our expertise in Platform Engineering, Kubernetes, and Cloud Native infrastructure enables us to connect infrastructure telemetry, workflow tracing, continuous evaluation, governance, and cost visibility into a coherent LLMOps platform.
Whether you need guidance on your observability strategy, support integrating these capabilities into an existing platform, or an end-to-end implementation with self-service abstractions for application and ML teams, we can help you move from isolated signals to an operational model that supports both day-to-day reliability and long-term improvement.
Share